Current numbers, October 6, 2026
Condos listed on the MLS right now, refreshed every six hours.
| Neighborhood | For sale | Median asking | Median $/sq ft | For rent | Median rent |
|---|---|---|---|---|---|
| Westwood | 114 | $1.15M | $735 | 101 | $5,400/mo |
| Century City | 48 | $2.19M | $1,166 | 23 | $11,500/mo |
Medians appear only when enough listings publish the figure; a dash means too few to report. Full neighborhood reports
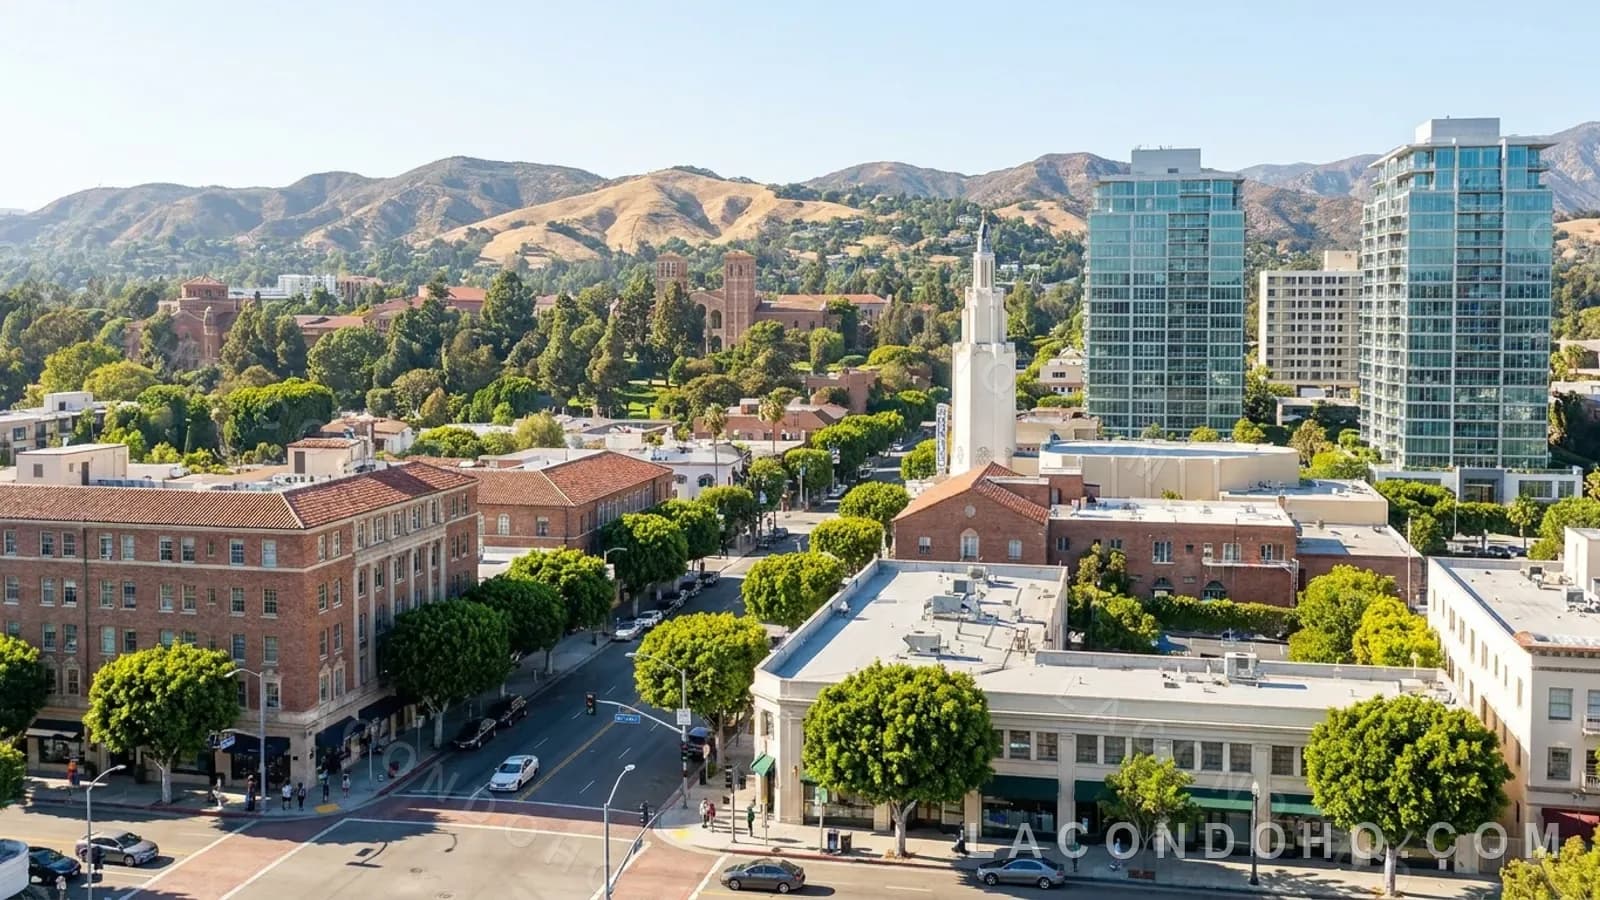
This is a dated reading of the Wilshire Corridor — the roughly one-mile wall of full-service towers along Wilshire Boulevard in Westwood — using only what our own building pages render from the live CRMLS feed. This week the richest closed-comparable data sits at Ten Five Sixty, the tower at 10560 Wilshire Boulevard, whose sales-stats page renders a deep run of recorded closings. Every figure below is quoted from that page as of this writing; closings and listings update continuously, so read this as a snapshot and pull the live page before acting on it.
Where these numbers come from
Each building profile on the site carries a sales-stats page with a Closed comparables table, drawn from the live feed by matching the building's street address. For Ten Five Sixty the table is unusually deep, which makes it a good corridor bellwether. One caution before the numbers: the table blends recorded sales with closed leases, so a handful of rows show monthly rents rather than purchase prices. The figures below are the genuine sale closings only — six- and seven-figure purchase prices with sensible price per foot — and the full table, rentals included, lives on the building's page. For citywide context, our market report at /market-stats renders the current Los Angeles condo figures; as of July 8, 2026 it showed an $865,000 median, $670 per square foot, 1,881 active condo listings, 9.4 months of supply and 76 average days on market.
The range at Ten Five Sixty
The recorded sales the page renders stretch across almost the entire spectrum a full-service tower can hold. At the top, a four-bedroom, four-bath penthouse — unit Penthouse A, 5,601 square feet — closed at $5,610,000, about $1,002 per square foot. A pair of large high-floor homes follow: unit 1803, a two-bed, three-bath at 3,605 square feet, closed at $3,200,000, about $888 a foot, and unit 2003, a three-bed, three-bath also at 3,605 square feet, at $2,900,000, about 804 a foot. In the mid-two-millions, unit 1901 at 2,798 square feet closed at $2,395,000 and unit 1806 at 2,820 square feet at $2,305,000 — roughly $856 and $817 per foot respectively. At the entry end, a compact studio, unit 205 at 355 square feet, closed at $180,000, and a two-bed, three-bath, unit 401 at 1,863 square feet, at $645,000.
Reading the spread
Two things jump out of that range. First, the same building sold a 180-thousand-dollar studio and a 5.6-million-dollar penthouse — a thirty-fold spread inside one address — which is exactly what a large, older full-service tower does: it stacks pied-a-terre studios, family-sized flats and trophy penthouses in the same elevator bank. Second, price per square foot does not track size in a straight line. The penthouse cleared just over $1,000 a foot, but a mid-floor two-bedroom, unit 1604 at 1,787 square feet, closed at $1,680,000, roughly 940 a foot — higher than several larger units in the sample. On the corridor, floor, view and renovation status move the per-foot number as much as raw square footage does. That is the single most useful lesson a closings table teaches: comp to units like yours in floor and condition, not just bedroom count.
What it means for buyers and sellers
For a buyer, a deep closings run like this is leverage you can hold in your hand. It shows what the building's own market actually paid — not asking prices — across floors and sizes, and it is the honest anchor for an offer. With the citywide report showing 9.4 months of supply and 76 days on market, corridor buyers have the time to insist on that kind of evidence. For a seller, the same table is the pricing discipline: a unit priced to the freshest same-line closings sells, and one priced to a neighbor's older wish number sits. Either way, the closed comp — not the list price down the hall — is the number that matters.
How to use this snapshot
Treat this as one dated reading, not a valuation. The figures here were on Ten Five Sixty's sales-stats page as of July 8, 2026, and the feed refreshes continuously, so a closing that shows today may age out of the sample next week. Use the pattern rather than any single row: a wide price band inside one tower, per-foot numbers set by floor and finish, and a citywide backdrop of ample supply and patient timelines. When you are ready to price a specific line — to buy or to sell — pull the current table on the building's page and the live citywide figures at /market-stats, and we will read the same-line comps with you.
Questions readers ask about Wilshire Corridor closings
Why do some rows in a closings table look like rents?
Because the table blends recorded sales with closed leases, so a handful of rows show monthly rents rather than purchase prices. The figures in this reading are the genuine sale closings only — six- and seven-figure purchase prices with sensible price per foot.
What range of closings did Ten Five Sixty show?
Almost the entire spectrum a full-service tower can hold. At the top, a four-bedroom, four-bath penthouse of 5,601 square feet closed at $5,610,000, about $1,002 per square foot. At the entry end, a compact studio, unit 205 at 355 square feet, closed at $180,000. That thirty-fold spread inside one address is exactly what a large, older full-service tower does — it stacks pied-a-terre studios, family-sized flats and trophy penthouses in the same elevator bank.
Does price per square foot track unit size?
Not in a straight line. The penthouse cleared just over $1,000 a foot, but a mid-floor two-bedroom, unit 1604 at 1,787 square feet, closed at $1,680,000, roughly $940 a foot — higher than several larger units in the sample. On the corridor, floor, view and renovation status move the per-foot number as much as raw square footage does.
How should a buyer use a closings table?
As leverage you can hold in your hand. It shows what the building's own market actually paid rather than asking prices, across floors and sizes, and it is the honest anchor for an offer. The single most useful lesson is to comp to units like yours in floor and condition, not just bedroom count.
What was the citywide backdrop?
As of July 8, 2026 our market report showed an $865,000 median, $670 per square foot, 1,881 active condo listings, 9.4 months of supply and 76 average days on market. With supply that deep, corridor buyers have the time to insist on same-line evidence.

Written by
LA Condo HQ
Real-estate research publisher
LA Condo HQ is published by Eltherion, LLC to help readers research Los Angeles buildings, neighborhoods and real-estate decisions. We publish source notes, ownership guides and practical tools, and help readers request introductions to licensed partner agents. We are not a licensed brokerage.